
Introduction
Co-expression analyses are useful tools for elucidating gene function. Genes coordinately expressed with a gene of interest are often functionally linked in the same biological pathway. Many cancer online analysis platforms provide co-expression analysis based on cancer transcriptomic data.
However, in cancer, a large fraction of the genome is affected by somatic copy number alterations (SCNA) ref such as amplifications and deletions, and correlation between mRNA abundance and DNA copy number are often observed. Because copy number gain and loss can lead to simultaneous over- and under-expression of multiple genes from the same genomic location, genes from the same DNA segment with copy number alteration also become correlated. As a consequence, standard co-expression analyses using cancer transcriptomic data often identify physically neighboring genes as co-expressing genes based on their positive correlation with the gene of interest.
Genomic Regression Analysis of Coordinated Expression (GRACE) is a method developed to remove effect of copy number alteration from co-expression analysis so that the resulting genes are mostly based on biological regulation. This database allows users to perform co-expression analysis with tumor or normal samples from various cancer types based on TCGA studies. The users may apply either GRACE or standard, non-SCNA adjusted method to perform analysis with tumor sample data. Standard method may also be applied for normal tissue samples, which lack frequent SCNAs. Functional enrichment analysis is also provided for interpretation of co-expressing genes.
Somatic Copy Number Alteration (SCNA) in Cancer
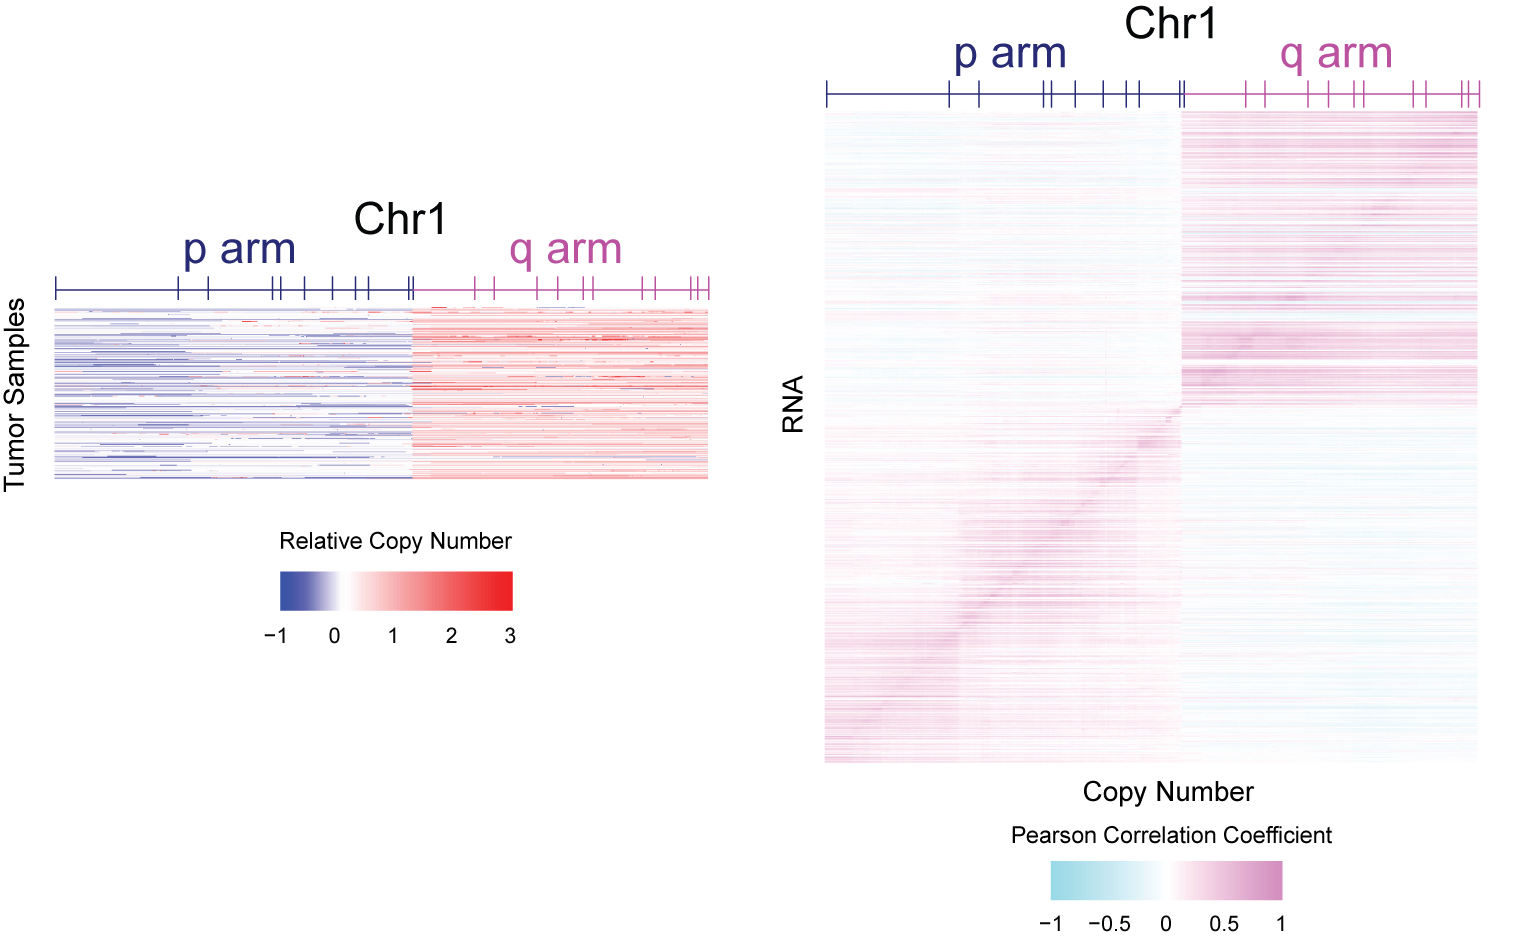
Somatic copy number alteration (SCNA) is commonly seen in cancer. For example, plotted in the figure are the relative copy number levels of chromosome 1 using 1075 samples from TCGA Breast Invasive Carcinoma (BRCA) study ref. Chromosome 1p is frequently deleted whereas 1q is frequently amplified in breast cancer. Consequently, RNA and genomic copy number for genes from the same arm of chromosome 1 are strongly correlated. This also results in correlation of neighboring genes on chromosome 1.
Standard Co-expression Analysis in Cancer
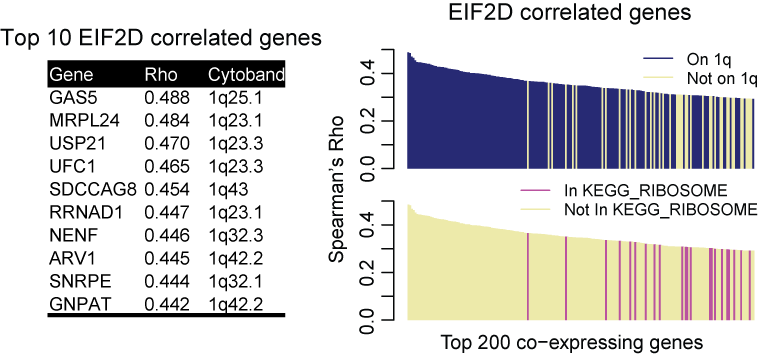
Because of frequent SCNA events in cancer, standard co-expression analysis using cancer transcriptomic data often identify physically neighboring genes as being co-expressed. For example, the top 10 co-expressing genes for EIF2D, a gene on chromosome 1q32, encoding eukaryotic translation initiation factor 2D that locates at chromosome 1q32, are all located nearby or from the same 1q32. This trend holds true for the top 200 co-expressing genes. And such bias is quite common in the cancer genome because of the ubiquity of SCNAs.
GRACE method
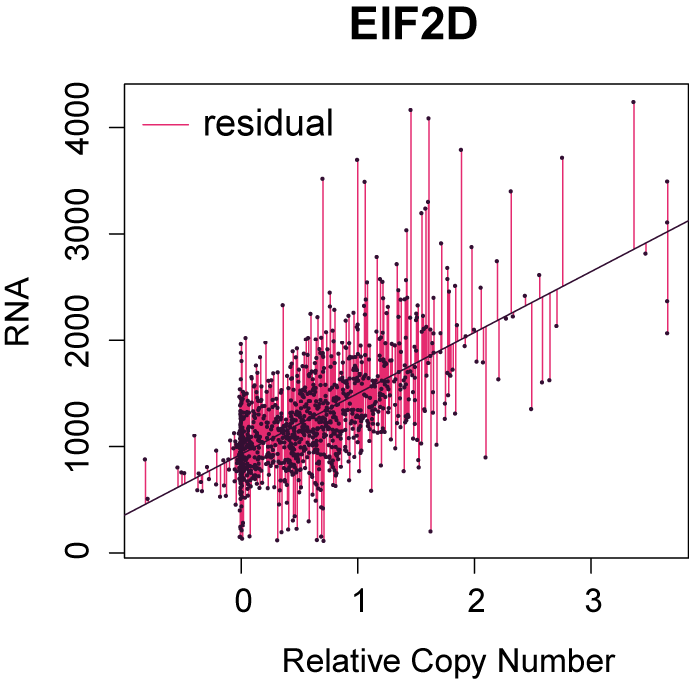
To correct for the bias from SCNA in co-expression analysis, we fit a linear regression model using copy number as the explanatory variable and RNA levels as the response variable. The residuals from this linear regression model represent variations in RNA that cannot be explained by copy number variations. Such residuals are calculated for every gene and are used for co-expression analysis instead of the original RNA levels. We have named this method Genomic Regression Analysis of Coordinated Expression (GRACE).
Genomic Regression Analysis of Coordinated Expression in Cancer
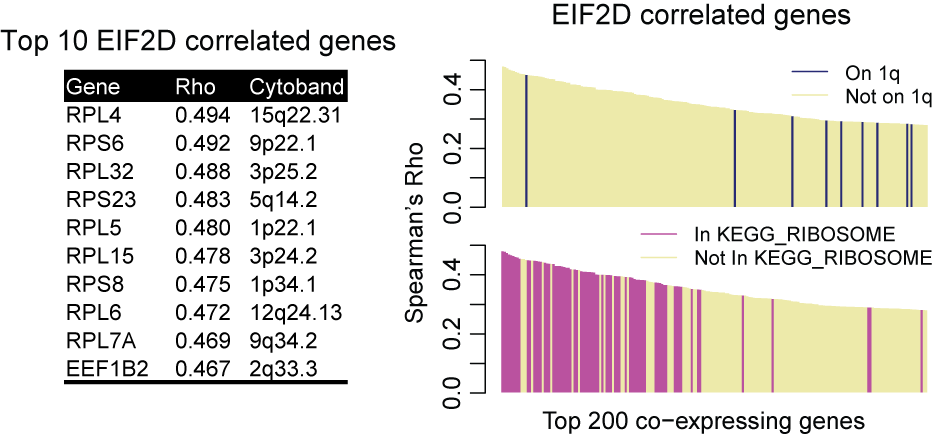
Using GRACE, the bias from SCNA is largely reduced. Using EIF2D again as an example, the top 10 coexpressing genes called by GRACE come from various chromosomes. But they are all involved in translation and therefore functionally relevant to EIF2D. The top 200 EIF2D coexpressing genes are no longer enriched in EIF2D neighboring genes from chromosome 1q. Instead, the list is topped by genes encoding ribosome subunits.