
Frequently Asked Questions
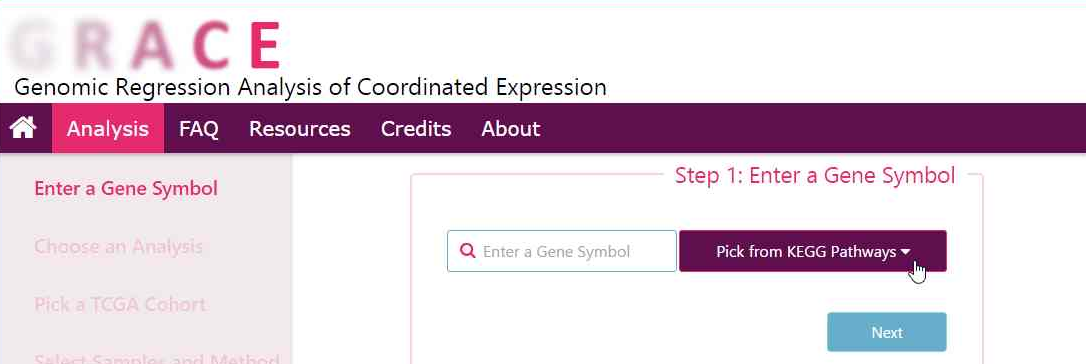
There are two ways to enter a gene for analysis. One way is to pick a gene from the KEGG pathway genes sets. Click the "Pick from KEGG Pathways" button to release the dropdown menu.
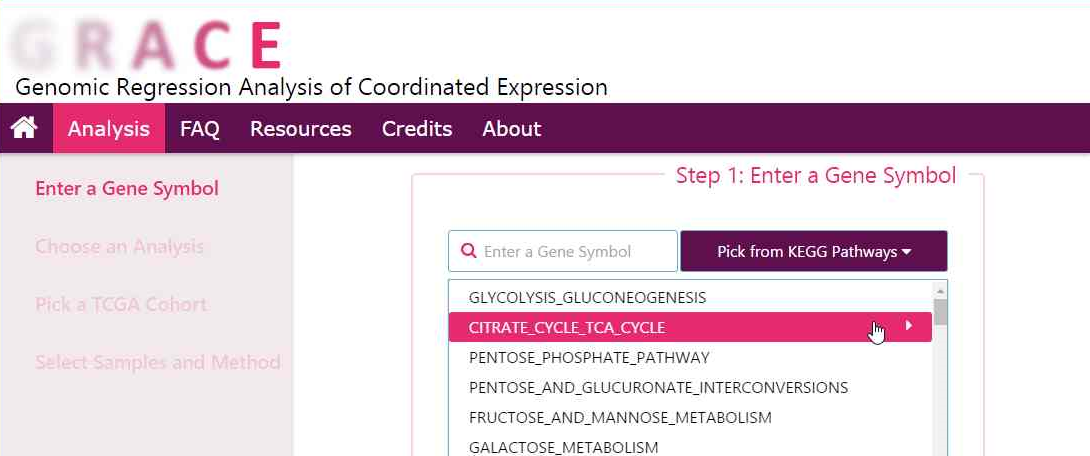
The list includes 186 pathway gene sets from the KEGG Pathway database.
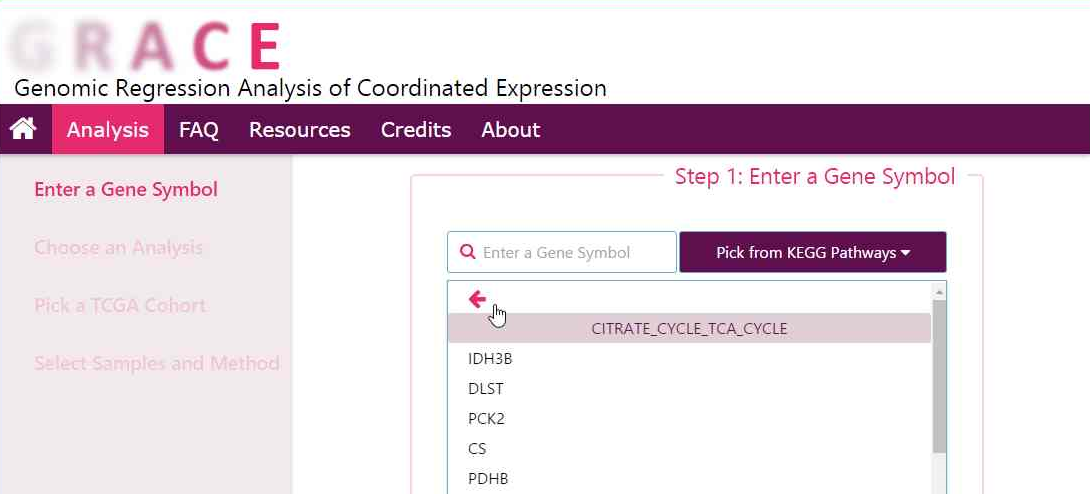
The user can browse the genes from a chosen gene set. They can also go back by clicking the back arrow to choose from the other KEGG pathway gene sets.
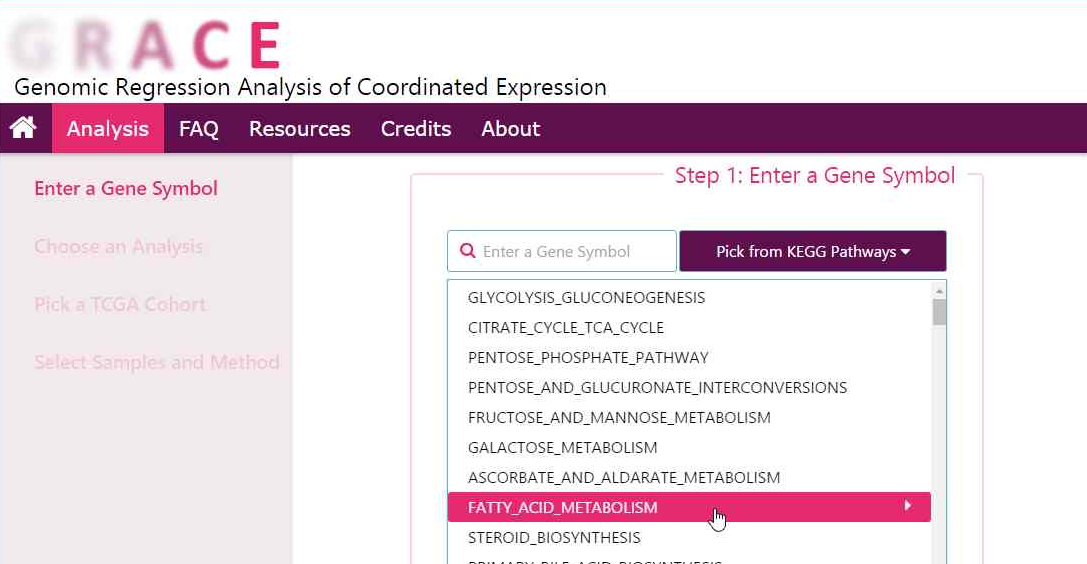
Another pathway gene set can be chosen from the menu.
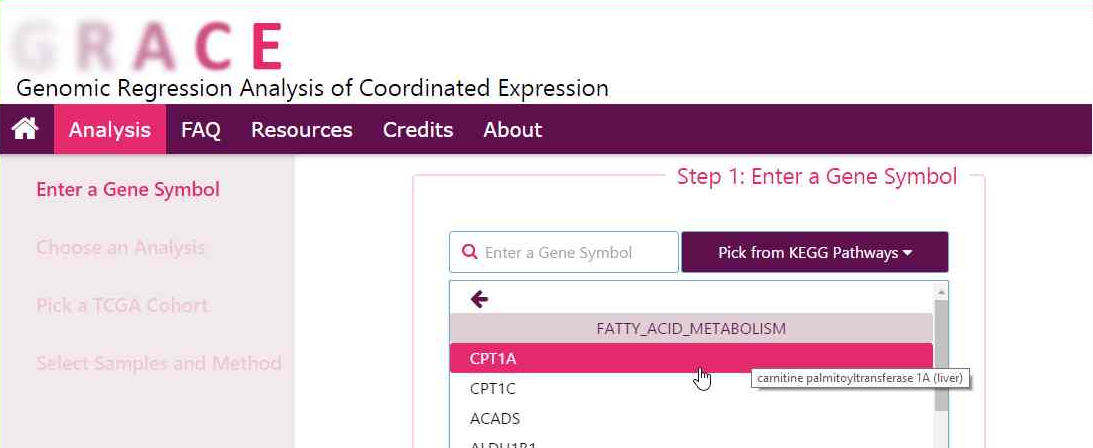
When the cursor rolls over the gene name, a description of the gene will be shown. Clicking on the gene will send the gene name to the search field.
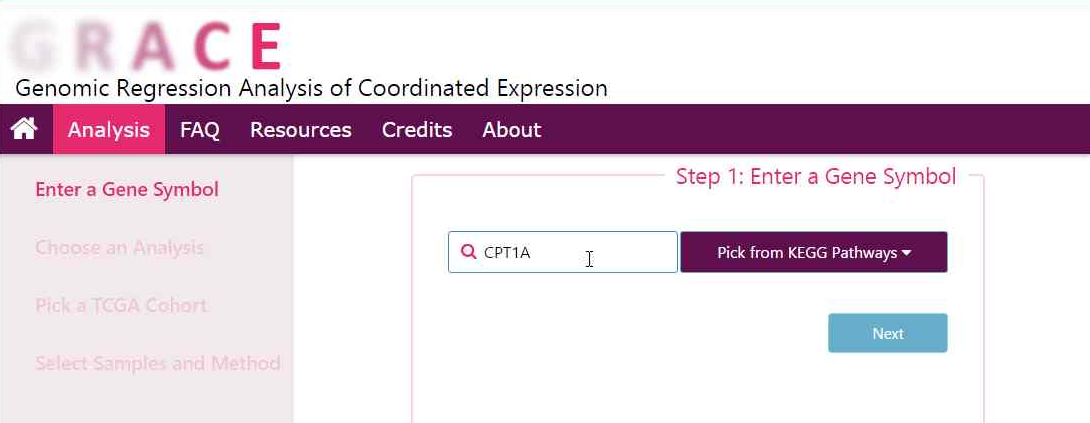
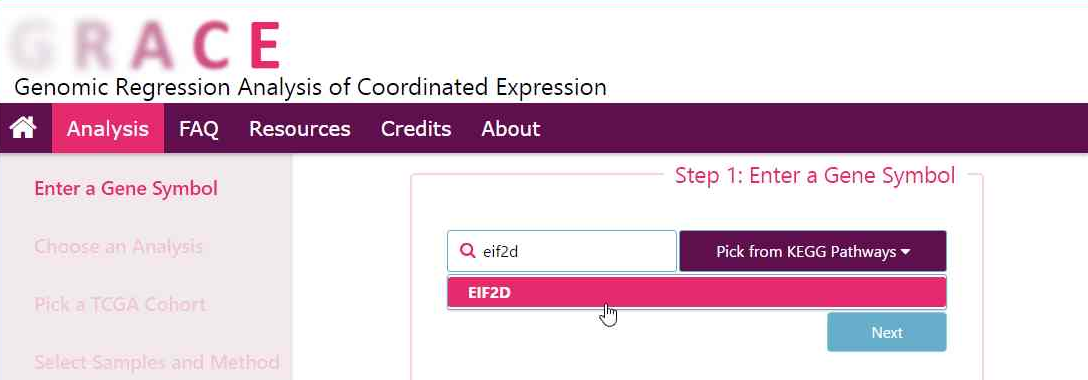
Alternatively, a gene name can be directly entered into the search field.
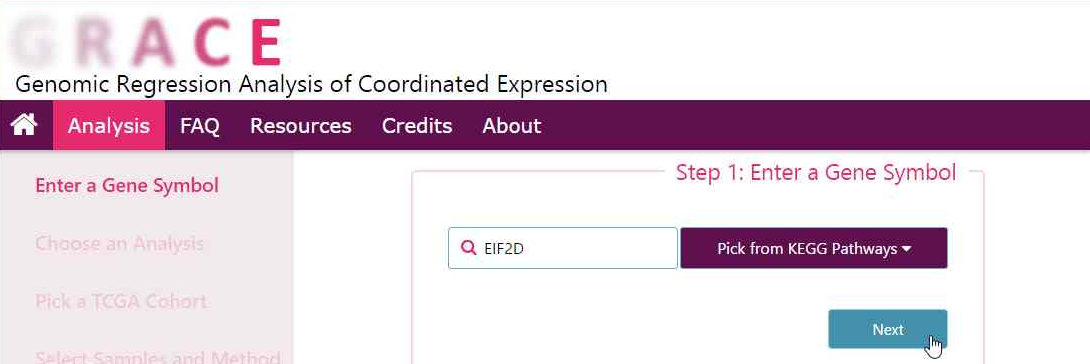
The user may click "Next" to submit the gene name. If the user did not enter a valid gene name, or no analysis is available for the gene entered by the user, a note will appear under the search field. If the gene name is valid, the user can progress to the next step and the gene name entered will be shown in the progress bar on the left.
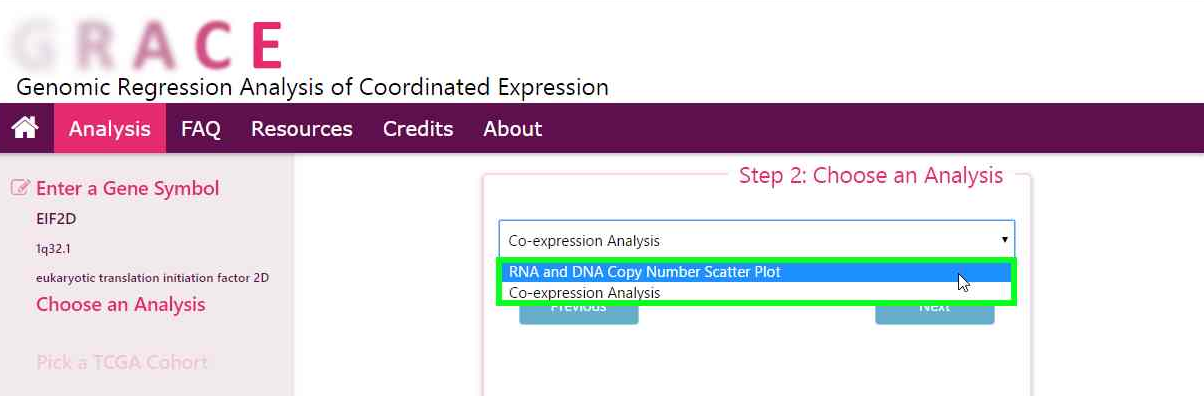
"RNA and DNA Copy Number Scatter Plot" can be chosen from the analysis option. Options may be disabled when data is not available for analysis.
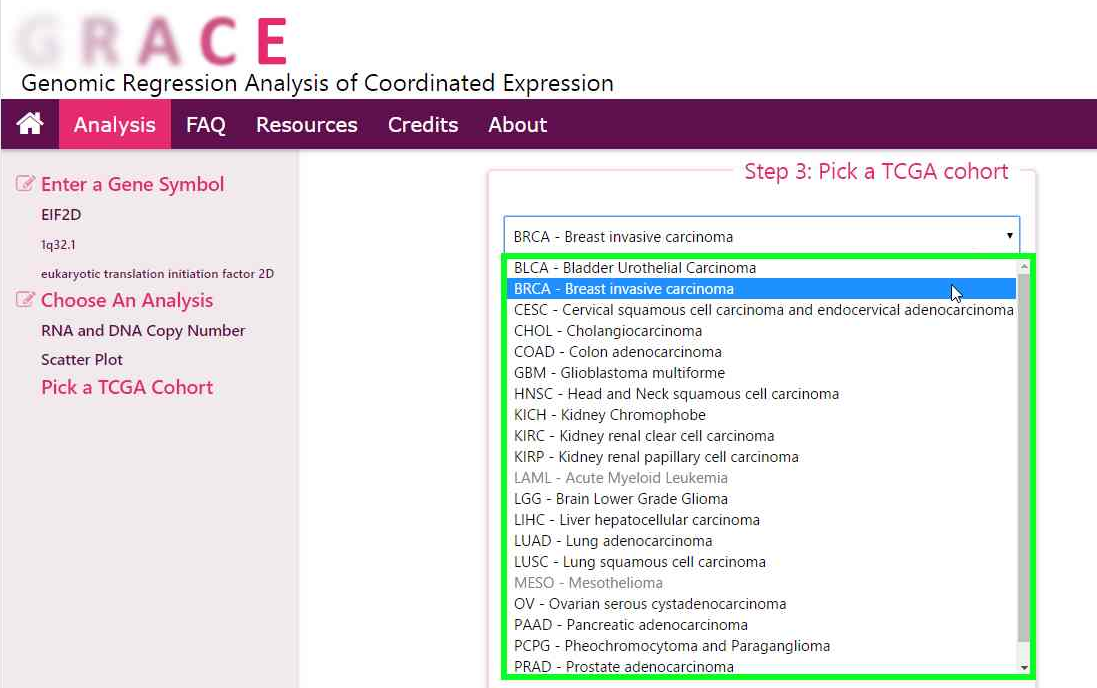
The user can choose a TCGA cohort. Options may be disabled when data is not available for analysis.
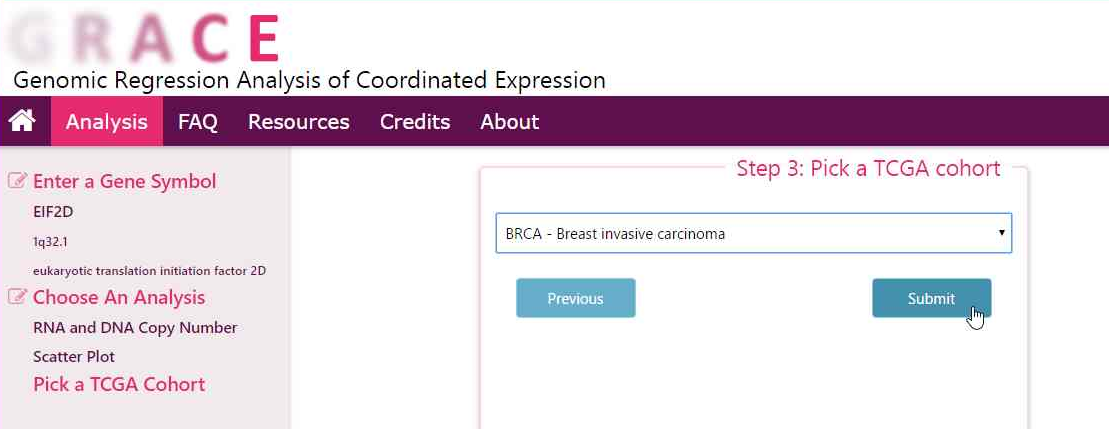
This is the final step for RNA and DNA copy number scatter plot analysis. The user may click "Submit" to view the result. If the user want to modify the previous steps, simply click "Previous" to go back.
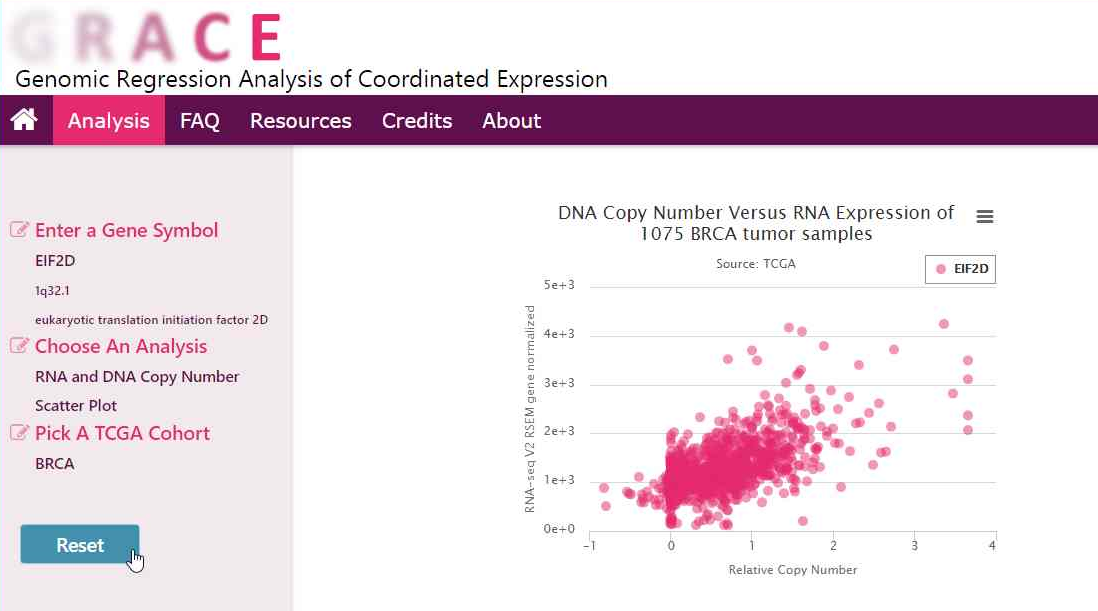
A scatter plot for RNA and DNA copy number will be generated for the chosen gene and cohort. To start another analysis, click "Reset" in the progress bar on the left.
There are two ways to enter a gene for analysis. One way is to pick a gene from the KEGG pathway genes sets. Click the "Pick from KEGG Pathways" button to release the dropdown menu.
The list includes 186 pathway gene sets from the KEGG Pathway database.
The user can browse the genes from a chosen gene set. They can also go back by clicking the back arrow to choose from the other KEGG pathway gene sets.
Another pathway gene set can be chosen from the menu.
When the cursor rolls over the gene name, the description of the gene will be shown. Clicking on the gene will send the gene name to the search field.
Alternatively, a gene name can be directly entered into the search field.
The user may click "Next" to submit the gene name. If the user did not enter a valid gene name, or no analysis is available for the gene entered by the user, a note will appear under the search field. If the gene name is valid, the user can progress to the next step and the gene name entered will be shown in the progress bar on the left.
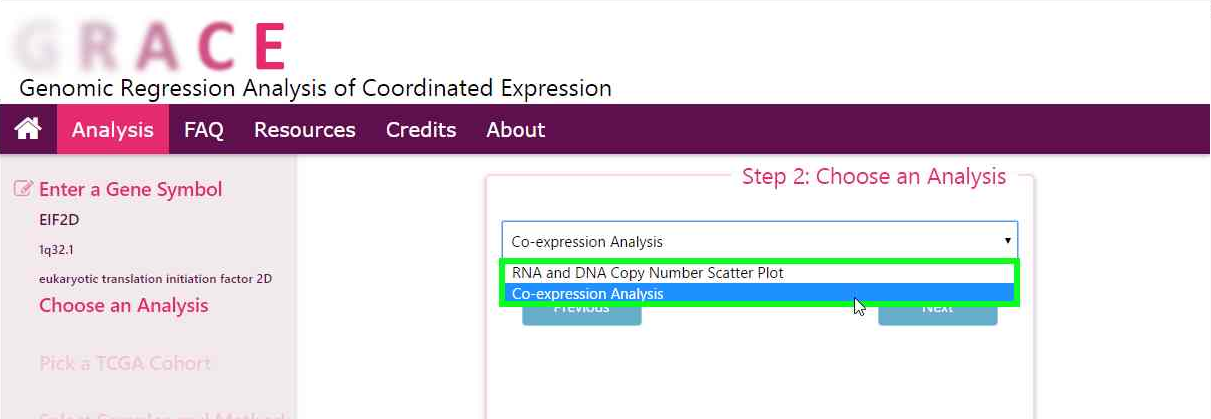
"Coexpression Analysis" can be chosen from the analysis options. Options may be disabled when data is not available for analysis.
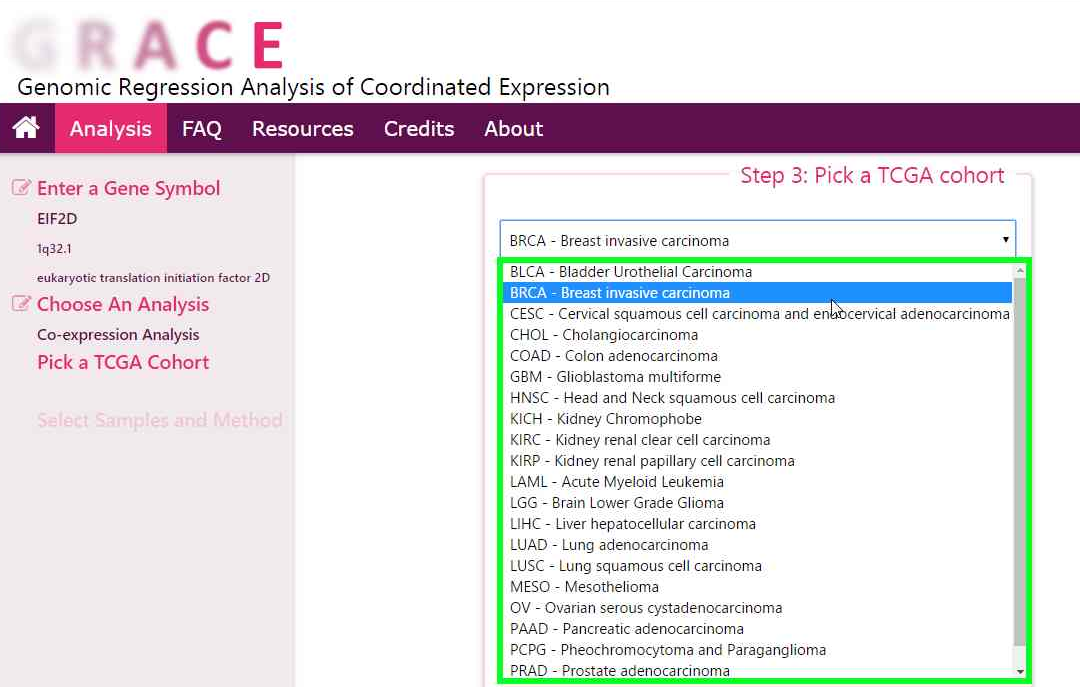
The user can choose a TCGA cohort. Options may be disabled when data is not available for analysis.
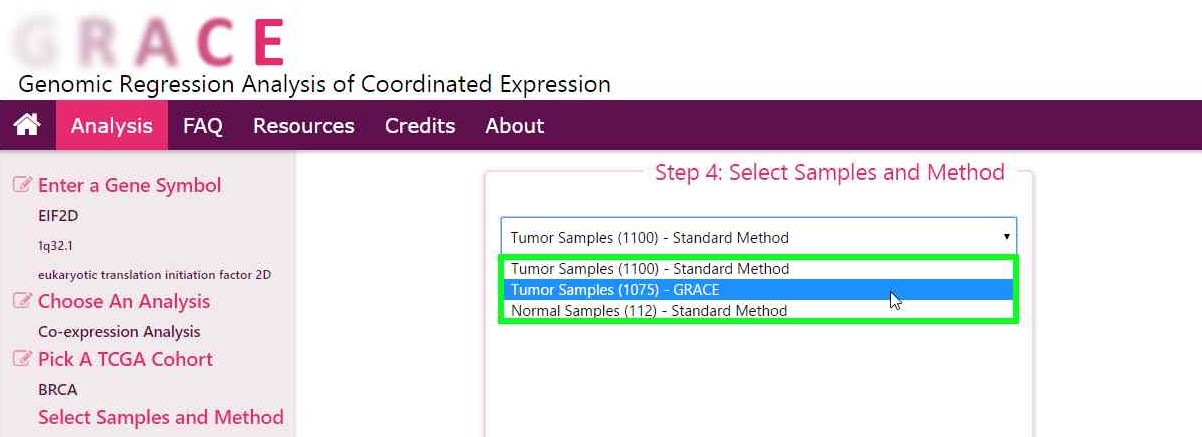
The user may choose to use data from tumor samples or normal samples to run the coexpression analysis. For tumor samples, the user can choose between the standard method and GRACE. The number of samples is also given in the option name. Note that the GRACE method generally has fewer samples than the standard method because some samples were excluded due to the unavailability of DNA copy number data. There might also be fewer genes returned by the GRACE method since genes with saturated DNA copy number levels are also excluded from the analysis.
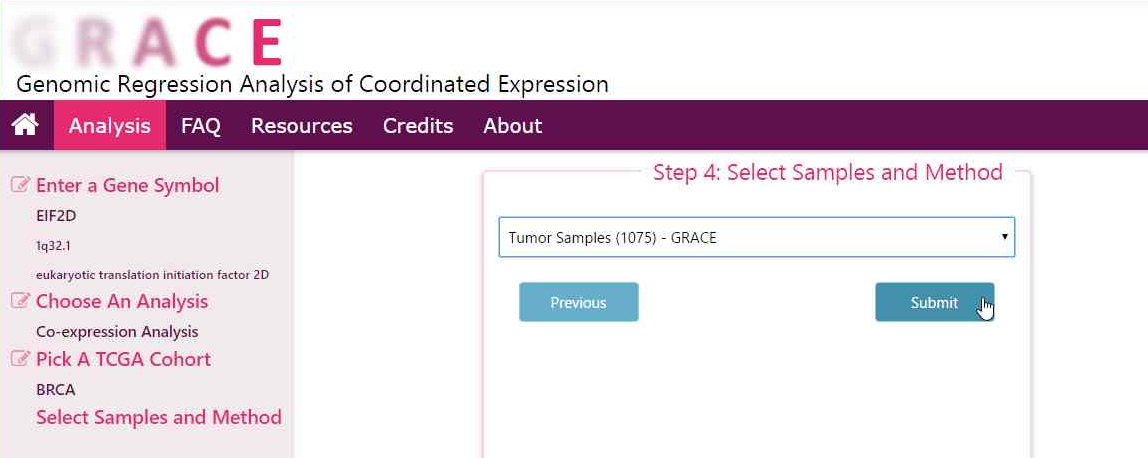
Click "Submit" to retrieve coexpressing genes.
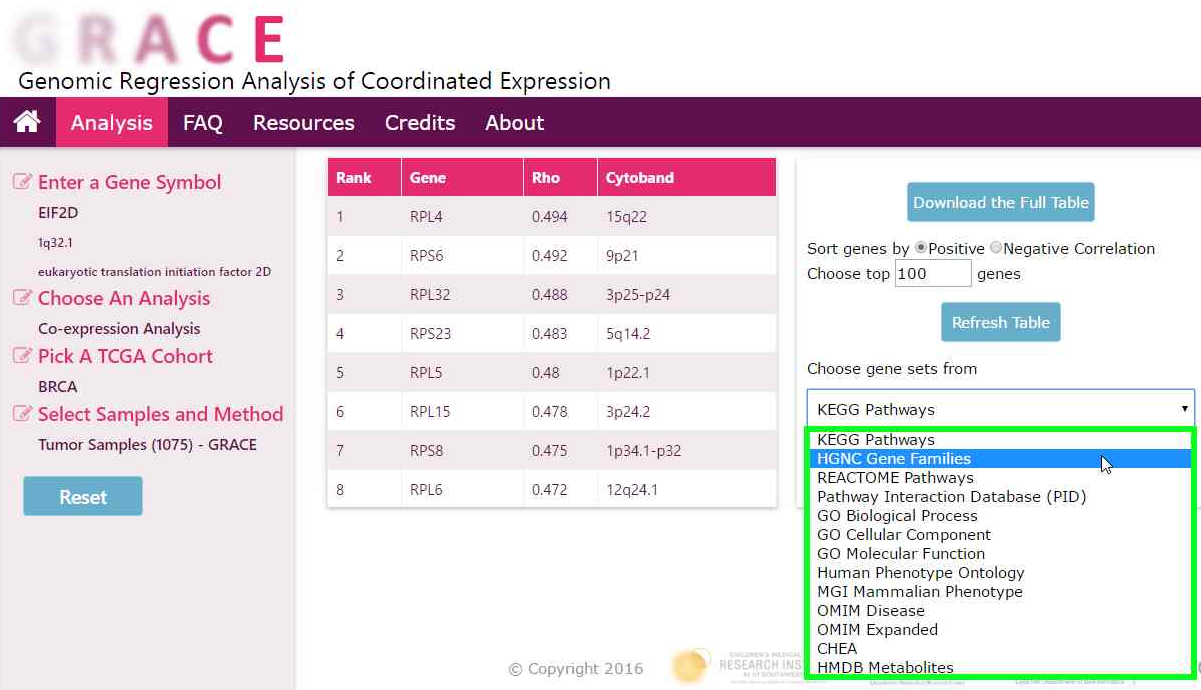
By default the co-expression analysis will show the top 100 positively correlated genes by Spearman rank correlation. When the cursor rolls over the gene name, description of the gene will appear; clicking the gene name will open a new tab that takes the user to a gene report from BioGPS There are several additional analysis options. For enrichment analysis, a list of gene set databases is provided for the user to choose from.
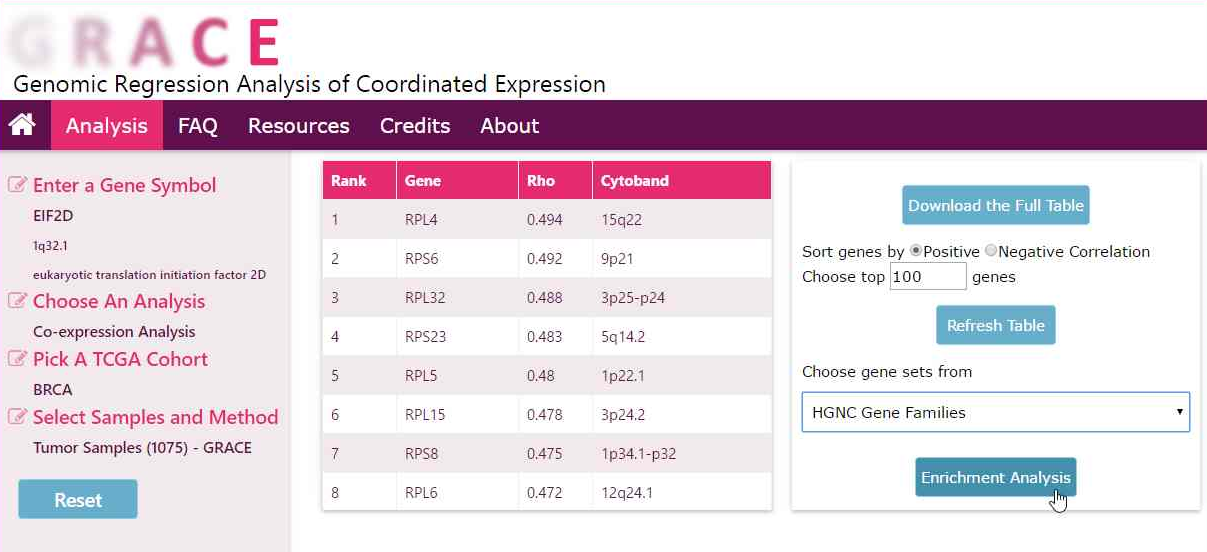
After choosing a gene set database, click "Enrichment Analysis" to run the enrichment analysis based on the hypergeometric test.
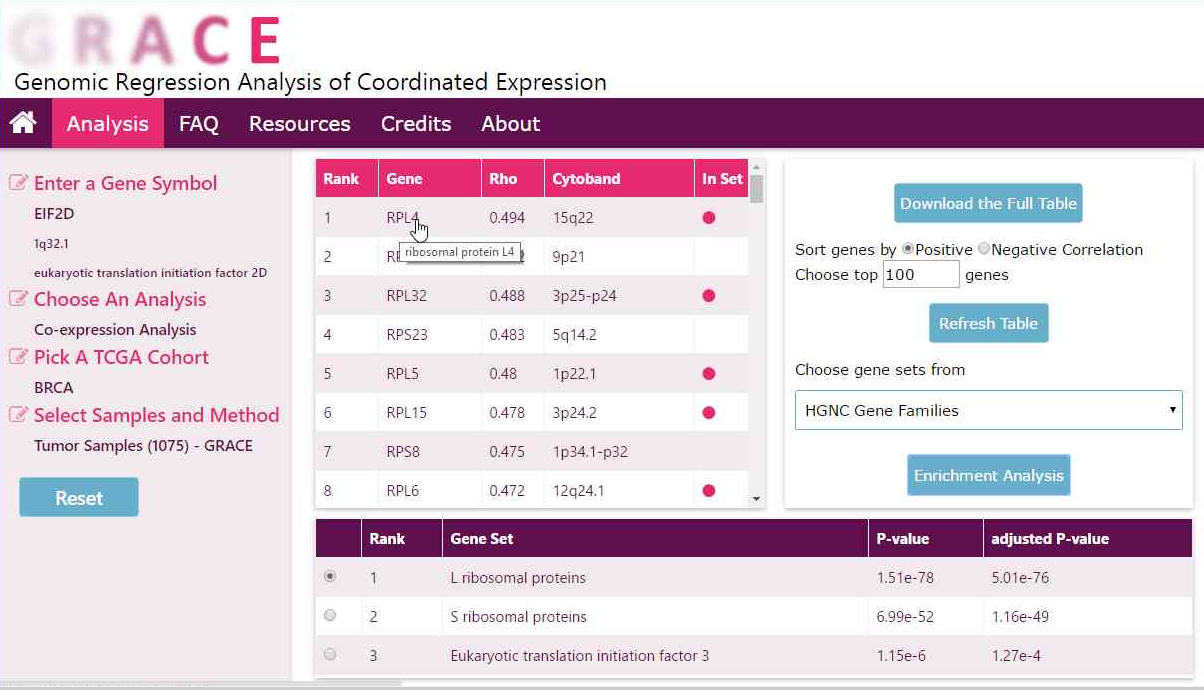
The result of the enrichment analysis will be given in a new table. Nominal P-values and Benjamini Hochberg adjusted P-values will be given. An "In Set" column will be added to the coexpression analysis result table to indicate whether the coexpressing genes belong to the selected gene set in the enriched gene set table.
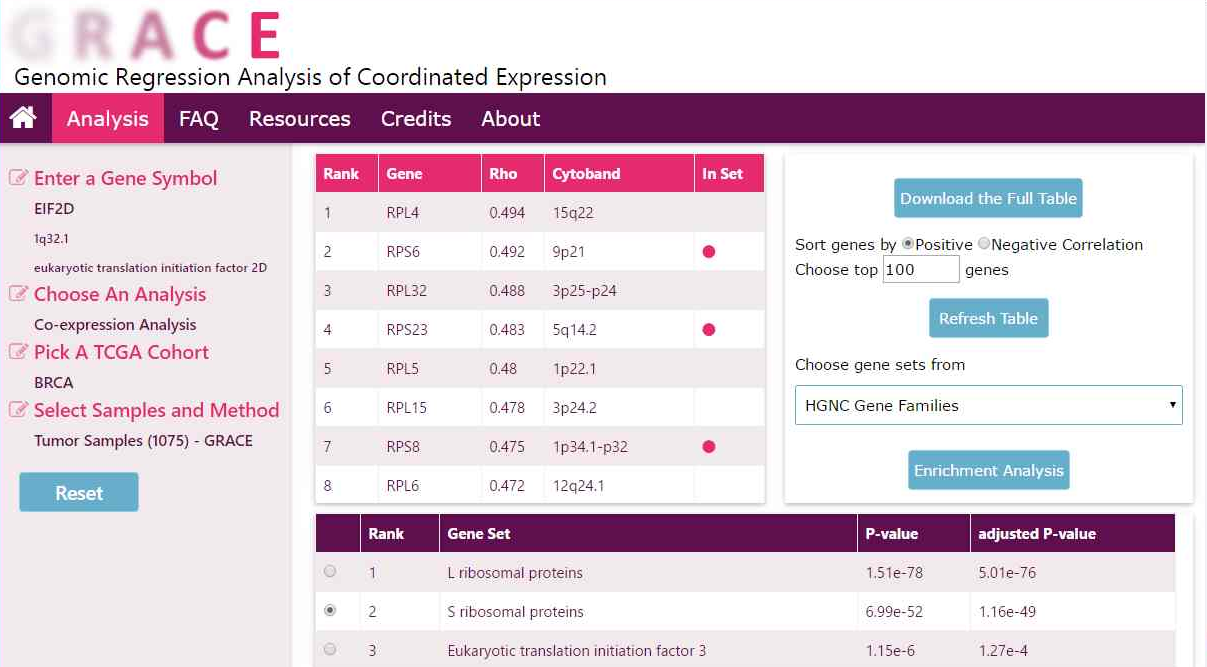
User may select other enriched gene sets from the table to check where genes from the gene sets are located in the coexpression gene table.
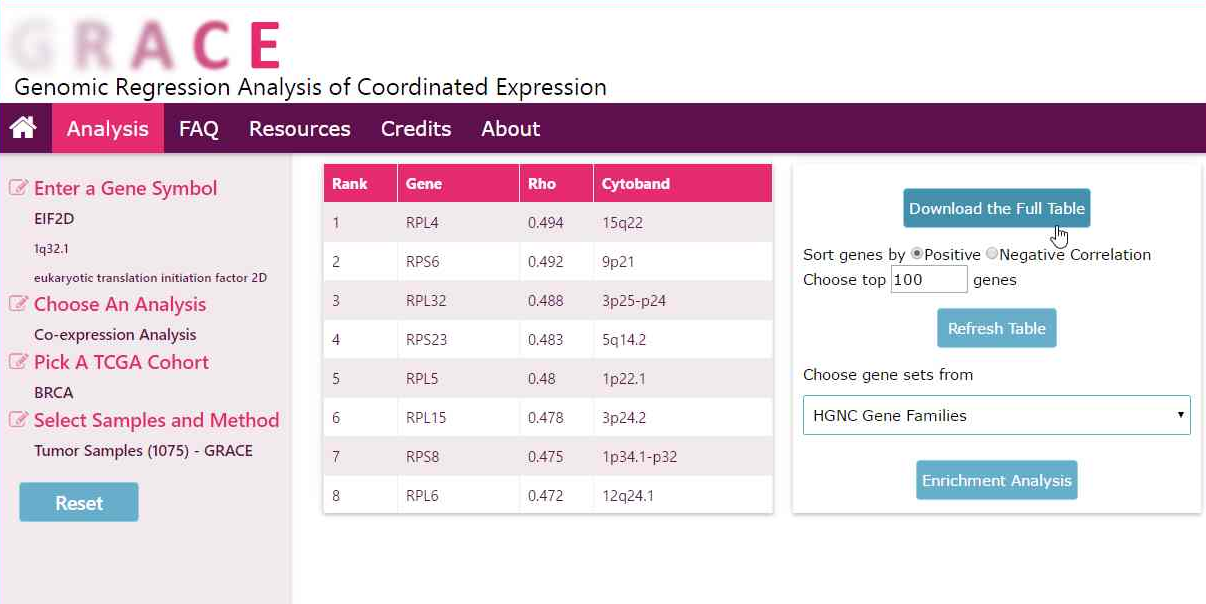
To download the full coexpression result, click "Download the Full Table".
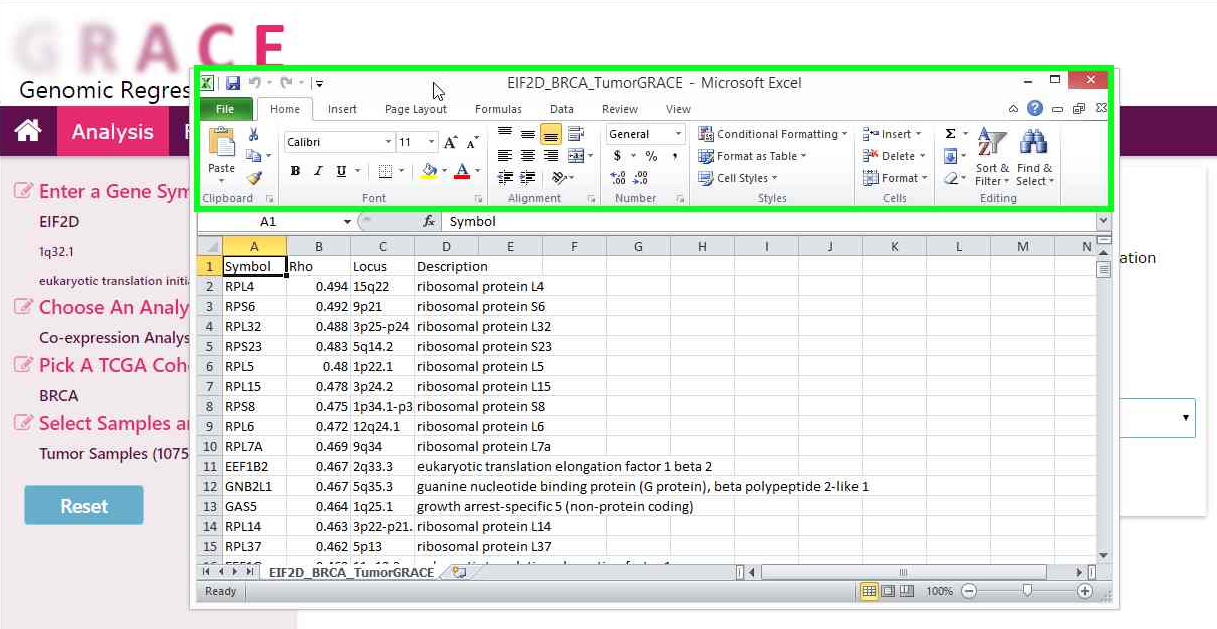
The downloaded CSV table will include the gene name, Spearman rank correlation coefficient, locus and description of the coexpressing genes.
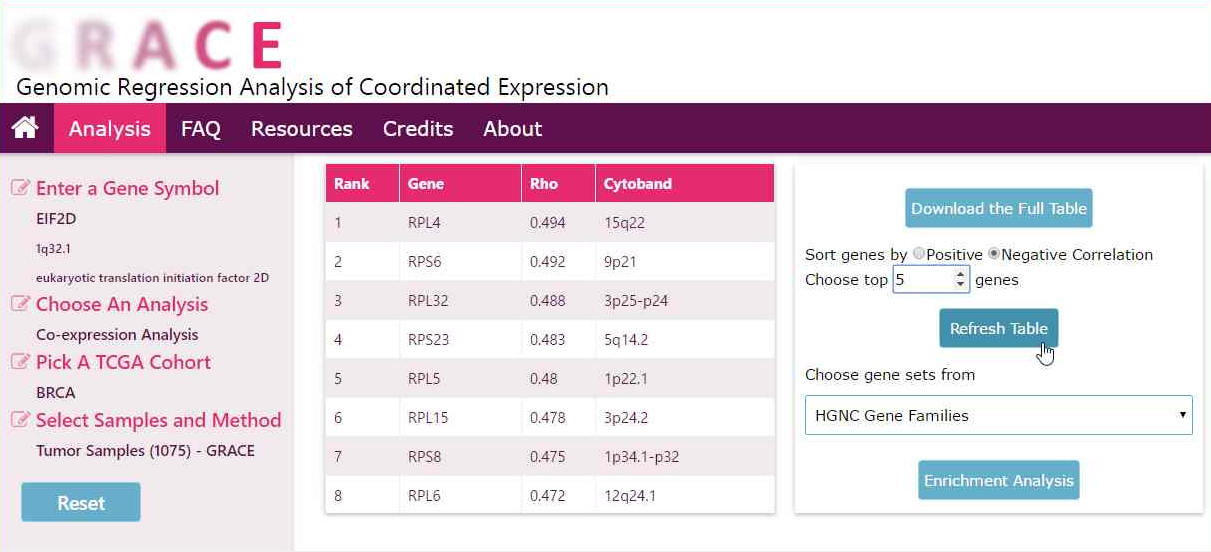
The user can also change the sorting order of the coexpression gene table and define the number of genes to be included in the coexpression analysis result.
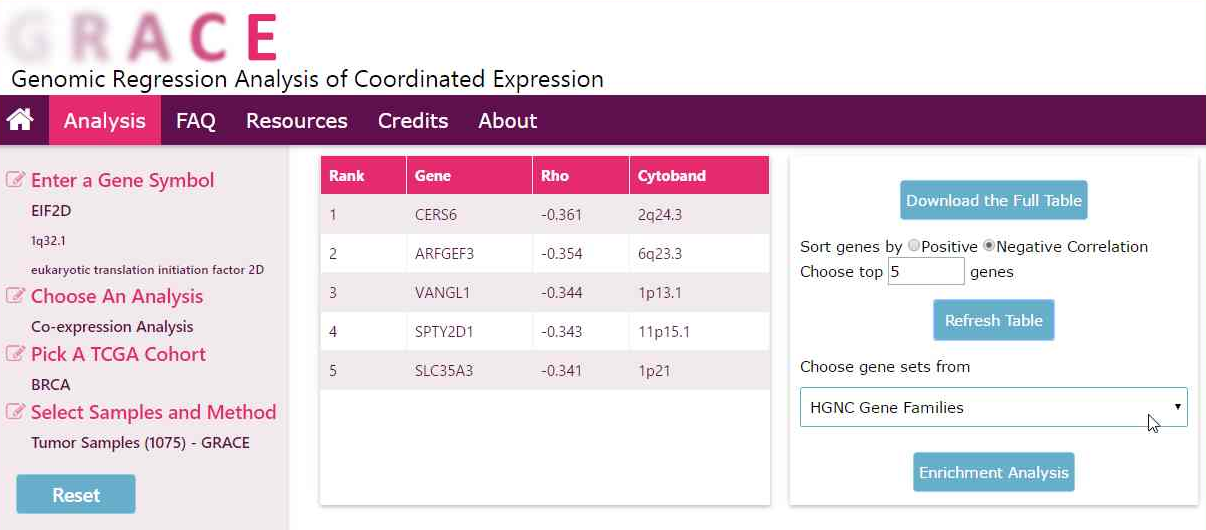
By click the "Refresh" button, the co-expression gene table will be refreshed with the customized parameters. Users may also use this customized table for enrichment analysis.
mRNA expression data and GISTIC DNA copy number data for over 20 TCGA disease cohorts were downloaded from FIREHOSE. "illuminahiseq_rnaseqv2-RSEM_genes_normalized" was downloaded as the mRNA data and "all_data_by_genes" was downloaded as DNA copy number data. In the scatter plot analysis, data was retrieved from FIREBROWSE Web API.
Gene set libraries in the enrichment analysis are downloaded from Molecular Signatures Database (MSigDB), Enrichr, and HGNC.
In our co-expression analysis, we remove genes that are under-expressed in too many samples (when over 90% of the samples have 0 RSEM values). In addition, when GRACE is applied, we also filter out genes with saturated DNA copy number values so that both the RNA and DNA copy number of the same gene can be in linear range. For example, ERBB2, a frequently amplified oncogene has a relative DNA copy number of 3.657 in 97 of the 1080 tumor samples and is therefore filtered out.
There are several reasons. In the case of co-expression analysis, some genes were filtered out because of under-expression or saturated DNA copy number (see answer to the previous question). For cohorts with no DNA copy number data available, co-expression analysis with GRACE cannot be performed. For cohorts with no normal sample data available, co-expression analysis for normal samples cannot be performed.
In the case of RNA and DNA Copy Number Scatter Plot generation, it is not available for cohorts without DNA copy number data.
No, login is not required – the website is open access.
Questions, suggestions, opinions and criticism are all welcome! Email to ling[dot]cai[at]utsouthwestern[dot]edu